这篇教程python中gradio的输出展示组件实例代码写得很实用,希望能帮到您。
- HTML:展示HTML内容,适用于富文本或网页布局。
- JSON:以JSON格式展示数据,便于查看结构化数据。
- KeyValues:以键值对形式展示数据。
- Label:展示文本标签,适用于简单的文本输出。
- Markdown:支持Markdown格式的文本展示。
- Plot:展示图表,如matplotlib生成的图表。
- Text:用于显示文本,适合较长的输出。
1、json列子import gradio as grimport json# 示例 JSON 数据json_data = { "name": "Gradio", "type": "Library", "languages": ["Python", "JavaScript"], "description": "Gradio is an open-source library that allows developers to build interactive applications with machine learning and data science projects."}# 将 JSON 数据转换为字符串格式json_str = json.dumps(json_data, indent=4)# 定义一个函数,它接受没有输入,并返回 JSON 字符串def show_json(): return json_str# 使用 Gradio 创建界面,JSON 组件展示数据gr.Interface(fn=show_json,inputs=None, outputs='json').launch()没有输入,点击generate显示了json数据 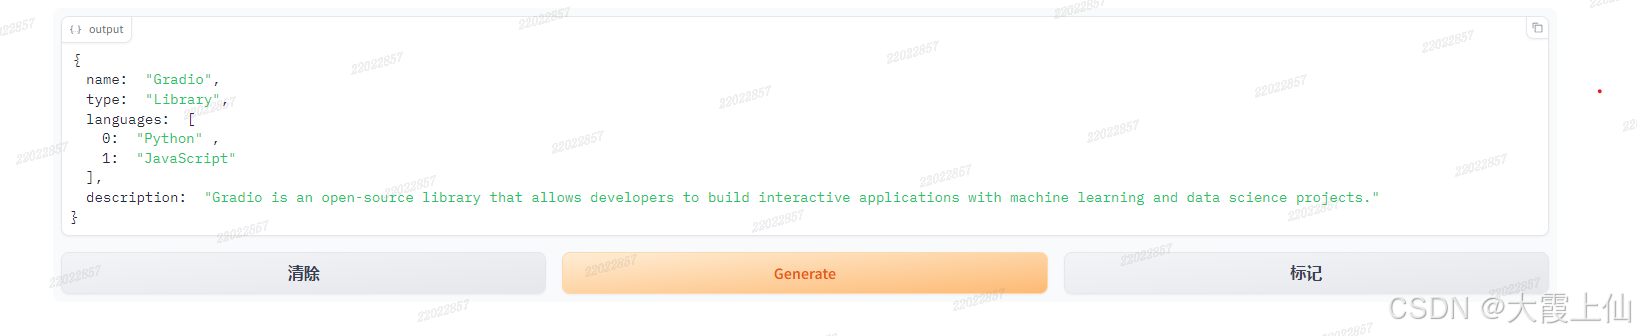
2、htmlimport gradio as grdef show_html(): return "<h1>Hello, Gradio!</h1><p>This is an HTML output.</p>"gr.Interface( fn=show_html, inputs=None, outputs="html").launch() 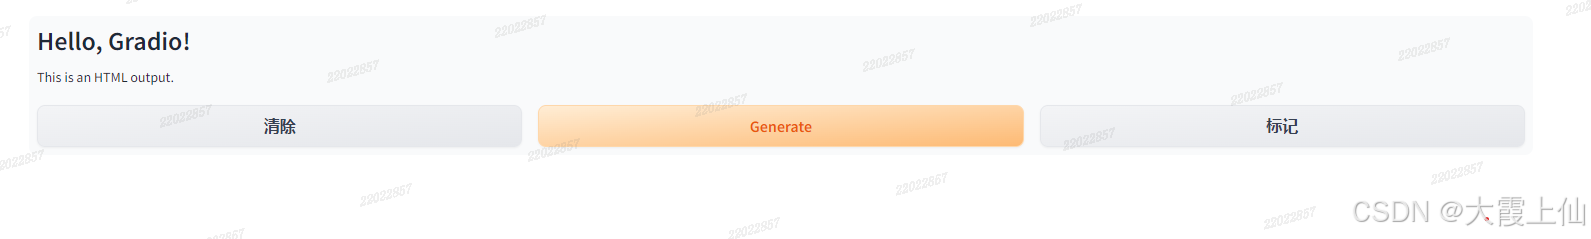
3、plotimport gradio as grdef process_list(my_list): # 对列表进行处理的示例函数 return f"接收到列表,长度为: {my_list}"# 创建一个包含列表输入的界面gr.Interface( process_list, gr.List(label="输入列表"), # 定义输入为列表 "text", title="列表输入示例").launch()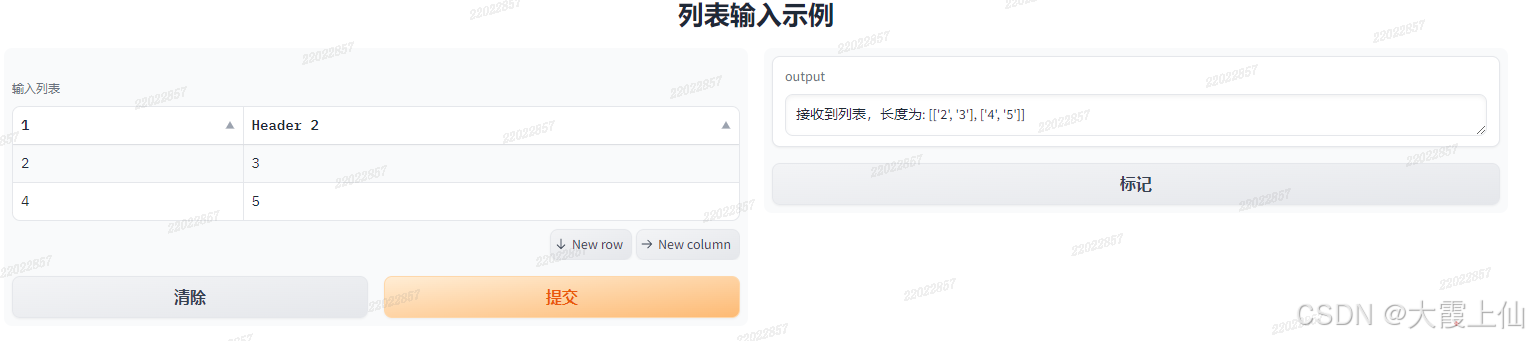
import gradio as grimport plotly.graph_objects as go# 创建一个简单的Plotly图表def create_plot(x_data, y_data): fig = go.Figure(data=go.Bar(x=x_data[0], y=y_data[0])) return fig# 创建Gradio界面interface = gr.Interface( fn=create_plot, inputs=[ gr.List(label="X Axis Data"), gr.List(label="Y Axis Data"), ], outputs='plot',)# 运行Gradio界面interface.launch() 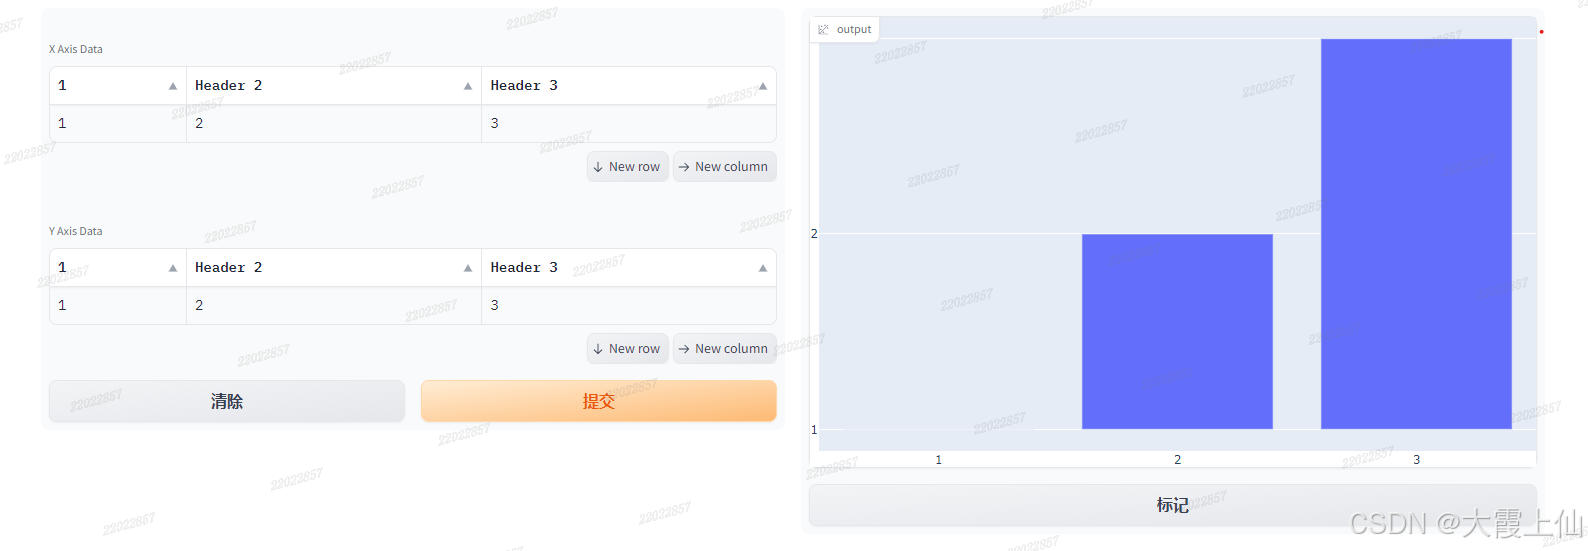
4、markdownimport gradio as gr# with open("example.md", "r") as f:# md_content = f.read()def show_markdown(markdown_text): return markdown_textinterface = gr.Interface( fn=show_markdown, inputs=gr.Textbox(lines=10), # value = md_content outputs=gr.Markdown())interface.launch()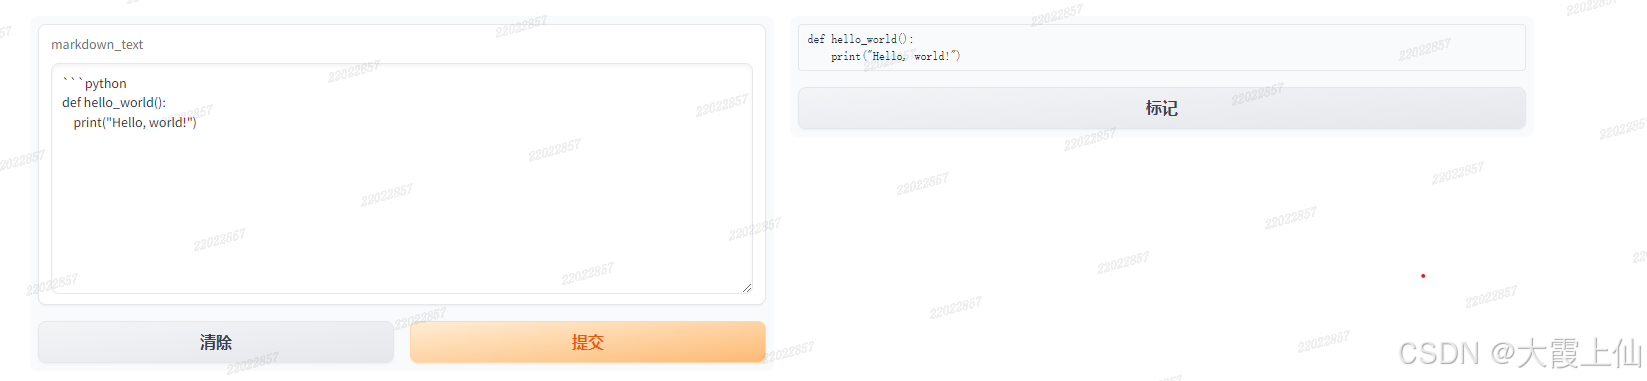
总结 到此这篇关于python中gradio的输出展示组件的文章就介绍到这了,更多相关python gradio输出展示组件内容请搜索本站以前的文章或继续浏览下面的相关文章希望大家以后多多支持本站!
Python
python使用DrissionPage库进行网页自动化操作和数据提取 |


