|
01 安装 Nginx 和 ab 工具
1.1 安装 nginxsudo apt-get install nginx -y # 安装Nginxsudo apt-get install apache2-utils -y # Ubuntu安装ab工具sudo yum -y install httpd-tools 0y # CentOS安装ab工具 在线安装完成后,Nginx主要文件目录构成如下 /etc/nginx # 配置文件/etc/nginx/sites-available # 虚拟主机/usr/sbin/nginx # 启动程序文件/var/log/nginx # 日志目录,包含access.log和error.log
1.2 启动 Nginx 并测试启动Nginx,并使用netstat命令查看端口 systemctl start nginx # 启动nginxnetstat -lntup|grep nginx # 查看nginx是否启动成功 使用压力测试工具测试Nginx,其中-c选项表示并发请求结果数,-n选项表示请求次数。下面命令表示进行100次请求,10个并发请求压力测试结果。另外,ab压测工具的一个缺陷是需要在压测URL后加上/符号。 ab -c 10 -n 100 172.16.255.131/ab -c 10 -n 100 172.16.255.131/test.html/ 压力测试完成之后,查看Nginx日志可以得到如下结果 root@master:/etc/nginx# tail -f /var/log/nginx/access.log 172.16.255.131 - - [28/Jul/2021:07:19:53 +0000] "GET / HTTP/1.0" 200 612 "-" "ApacheBench/2.3"172.16.255.131 - - [28/Jul/2021:07:19:53 +0000] "GET / HTTP/1.0" 200 612 "-" "ApacheBench/2.3"172.16.255.131 - - [28/Jul/2021:07:19:53 +0000] "GET / HTTP/1.0" 200 612 "-" "ApacheBench/2.3"172.16.255.131 - - [28/Jul/2021:07:19:53 +0000] "GET / HTTP/1.0" 200 612 "-" "ApacheBench/2.3"172.16.255.131 - - [28/Jul/2021:07:19:53 +0000] "GET / HTTP/1.0" 200 612 "-" "ApacheBench/2.3"172.16.255.131 - - [28/Jul/2021:07:19:53 +0000] "GET / HTTP/1.0" 200 612 "-" "ApacheBench/2.3"172.16.255.131 - - [28/Jul/2021:07:19:53 +0000] "GET / HTTP/1.0" 200 612 "-" "ApacheBench/2.3"172.16.255.131 - - [28/Jul/2021:07:19:53 +0000] "GET / HTTP/1.0" 200 612 "-" "ApacheBench/2.3"172.16.255.131 - - [28/Jul/2021:07:19:53 +0000] "GET / HTTP/1.0" 200 612 "-" "ApacheBench/2.3"172.16.255.131 - - [28/Jul/2021:07:19:53 +0000] "GET / HTTP/1.0" 200 612 "-" "ApacheBench/2.3"
02 使用 Filebeat 采集日志并展示
2.1 配置 filebeat 采集 Nginx 日志在/etc/filebeat/filebeat.yml配置文件中对filebeat进行配置,将nginx的日志路径/var/log/nginx/access.log添加到filebeat的输入配置中 vim /etc/filebeat/filebeat.yml # 打开filebeat配置文件# 采集日志数据配置filebeat.inputs: - type: log enabled: true paths: - /var/log/nginx/access.log
2.2 使用 Kibana 展示 Nginx 日志数据采集日志数据 配置好filebeat采集Nginx日志数据之后,在ES-head中可以看到如下日志内容 
创建日志数据索引 然后在服务器启动kibana并使用浏览器访问http://115.156.128.172:5601/进入kibana。在该页面中选择添加数据Add your data 
然后,选择创建索引create index pattern 
在提示栏中,选择对应filebeat采集的日志数据创建索引,并选择时间戳@timestamp 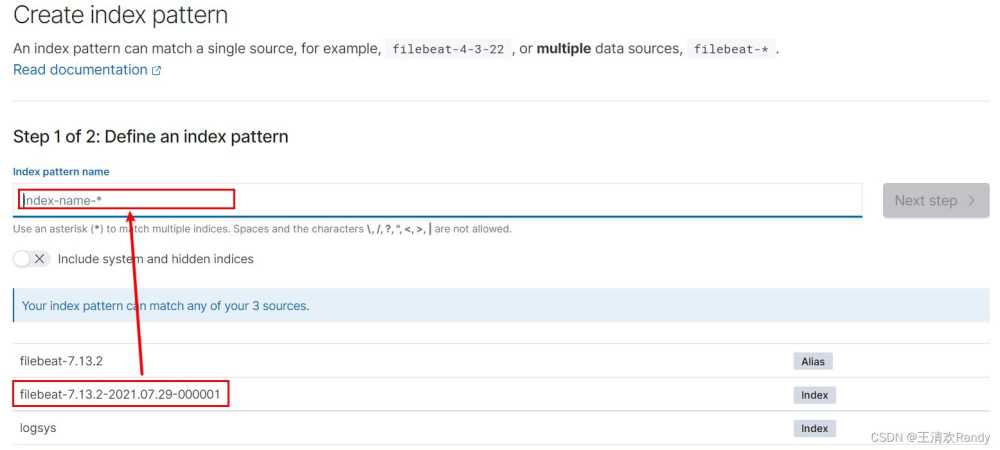

查看日志数据 完成索引创建之后,使用Discovery查看日志数据 
在日志数据通过设置日志范围和日志字段查看指定日志内容,也可以通过全文搜索和添加过滤器的功能查看指定数据 
03 采集 JSON 格式的 Nginx 日志默认情况下Nginx的日志数据是一条文本条目,日志条目中的字段无法拆分显示。采用怎样的方式可以将这种非结构化的日志内容转化成格式化的内容呢? # 将如下日志条目message:172.16.255.131 - - [28/Jul/2021:07:19:53 +0000] "GET / HTTP/1.0" 200 612 "-" "ApacheBench/2.3"# 转换成JSON半结构化数据如下{ "IP Address": 172.16.255.131, "Time": [28/Jul/2021:07:19:53 +0000], "HTTP Request": GET / HTTP/1.0 200 612, "Agent": ApacheBench/2.3 }
3.1 修改 Nginx 日志为 Json 格式一种方法是直接将Nginx产生的日志采用Json格式保存,编辑Nginx的配置文件/etc/nginx/nginx.conf,添加日志保存样式 vim /etc/nginx/nginx.conf # 找到http中的logging settings# 添加如下内容log_format log_json '{ "@time_local": "$time_local", ' '"remote_addr": "$remote_addr", ' '"referer": "$http_referer", ' '"request": "$request", ' '"status": $status, ' '"bytes": $body_bytes_sent, ' '"agent": "$http_user_agent", ' '"x_forwarded": "$http_x_forwarded_for", ' '"up_addr": "$upstream_addr",' '"up_host": "$upstream_http_host",' '"up_resp_time": "$upstream_response_time",' '"request_time": "$request_time"'' }';
测试nginx配置文件修改是否有效,得到如下输出说明成功 root@master:/home/wang# nginx -tnginx: the configuration file /etc/nginx/nginx.conf syntax is oknginx: configuration file /etc/nginx/nginx.conf test is successful 清空Nginx原有的日志数据,重新启动Nginx并使用ab工具重新对其进行压测,产生新的日志数据 > /var/log/nginx/access.log # 清空Nginx原有的日志数据systemctl restart nginx # 重新启动Nginxab -c 10 -n 100 172.16.255.131/ # 使用ab工具重新进行压测 查看Nginx日志,可以看到Nginx日志已经被重新以Json格式存储 root@master:/home/wang# tail -f /var/log/nginx/access.log{ "@timestamp": "30/Jul/2021:03:17:09 +0000", "remote_addr": "172.16.255.131", "referer": "-", "request": "GET / HTTP/1.0", "status": 200, "bytes": 612, "agent": "ApacheBench/2.3", "x_forwarded": "-", "up_addr": "-","up_host": "-","up_resp_time": "-","request_time": "0.000" }{ "@timestamp": "30/Jul/2021:03:17:09 +0000", "remote_addr": "172.16.255.131", "referer": "-", "request": "GET / HTTP/1.0", "status": 200, "bytes": 612, "agent": "ApacheBench/2.3", "x_forwarded": "-", "up_addr": "-","up_host": "-","up_resp_time": "-","request_time": "0.000" }{ "@timestamp": "30/Jul/2021:03:17:09 +0000", "remote_addr": "172.16.255.131", "referer": "-", "request": "GET / HTTP/1.0", "status": 200, "bytes": 612, "agent": "ApacheBench/2.3", "x_forwarded": "-", "up_addr": "-","up_host": "-","up_resp_time": "-","request_time": "0.000" }{ "@timestamp": "30/Jul/2021:03:17:09 +0000", "remote_addr": "172.16.255.131", "referer": "-", "request": "GET / HTTP/1.0", "status": 200, "bytes": 612, "agent": "ApacheBench/2.3", "x_forwarded": "-", "up_addr": "-","up_host": "-","up_resp_time": "-","request_time": "0.000" }{ "@timestamp": "30/Jul/2021:03:17:09 +0000", "remote_addr": "172.16.255.131", "referer": "-", "request": "GET / HTTP/1.0", "status": 200, "bytes": 612, "agent": "ApacheBench/2.3", "x_forwarded": "-", "up_addr": "-","up_host": "-","up_resp_time": "-","request_time": "0.000" }{ "@timestamp": "30/Jul/2021:03:17:09 +0000", "remote_addr": "172.16.255.131", "referer": "-", "request": "GET / HTTP/1.0", "status": 200, "bytes": 612, "agent": "ApacheBench/2.3", "x_forwarded": "-", "up_addr": "-","up_host": "-","up_resp_time": "-","request_time": "0.000" }{ "@timestamp": "30/Jul/2021:03:17:09 +0000", "remote_addr": "172.16.255.131", "referer": "-", "request": "GET / HTTP/1.0", "status": 200, "bytes": 612, "agent": "ApacheBench/2.3", "x_forwarded": "-", "up_addr": "-","up_host": "-","up_resp_time": "-","request_time": "0.000" }{ "@timestamp": "30/Jul/2021:03:17:09 +0000", "remote_addr": "172.16.255.131", "referer": "-", "request": "GET / HTTP/1.0", "status": 200, "bytes": 612, "agent": "ApacheBench/2.3", "x_forwarded": "-", "up_addr": "-","up_host": "-","up_resp_time": "-","request_time": "0.000" }{ "@timestamp": "30/Jul/2021:03:17:09 +0000", "remote_addr": "172.16.255.131", "referer": "-", "request": "GET / HTTP/1.0", "status": 200, "bytes": 612, "agent": "ApacheBench/2.3", "x_forwarded": "-", "up_addr": "-","up_host": "-","up_resp_time": "-","request_time": "0.000" }{ "@timestamp": "30/Jul/2021:03:17:09 +0000", "remote_addr": "172.16.255.131", "referer": "-", "request": "GET / HTTP/1.0", "status": 200, "bytes": 612, "agent": "ApacheBench/2.3", "x_forwarded": "-", "up_addr": "-","up_host": "-","up_resp_time": "-","request_time": "0.000" }
3.2 Filebeat 重新采集 Nginx 日志配置Filebeat识别Json格式日志 修改Nginx保存日志格式为Json之后,还需要对采集日志的Filebeat进行重新配置,如果不对其进行配置识别Json格式日志,被采集的日志仍然会以文本条目的形式被采集。 # 打开filebeat配置文件vim /etc/filebeat/filebeat.yml# 添加配置内容,配置内容可以参考官方手册- type: log # Change to true to enable this input configuration. enabled: true # Paths that should be crawled and fetched. Glob based paths. paths: - /var/log/nginx/access.log # 添加如下三行配置内容,识别Json格式日志文件,将日志条目以Json格式解析 json.keys_under_root: true json.overwrite_keys: true tags: ["access"] 清空Nginx日志,并重新启动filebeat;filebeat监控Nginx日志后,采用ab压测工具生成日志并采集。 > /var/log/nginx/access.logsystemctl restart filebeatab -c 10 -n 100 172.16.255.131/ 采用ES-head查看采集的日志数据可以看到日志数据以Json格式保存在ES中 
使用Kibana查看Json格式的日志条目 创建新的Kibana索引后,使用Discovery查看日志数据,并可以通过日志条目级的字段到达更有效的日志分析目的 
3.3 自定义存储 Filebeat 采集日志的 ES 索引之前使用Filebeat采集Nginx日志都是采用默认的索引创建方式形如filebeat-7.13.2-2021.07.30-000001,为了更好的识别索引和扩大日志采集的时间跨度,需要自定义存储索引名称。 自定义存储索引通过配置Filebeat实现,在Filebeat的配置文件中对输出进行配置如下: # 打开filebeat配置文件vim /etc/filebeat/filebeat.yml# 添加配置内容,配置内容可以参考官方手册# ---------------------------- Elasticsearch template setting ----------------------setup.template.settings: index.number_of_shards: 1 #index.codec: best_compression #_source.enabled: falsesetup.template.name: "nginx" # 名字和index中的名字一致setup.template.pattern: "nginx-*"setup.template.enabled: falsesetup.template.overwrite: truesetup.ilm.enabled: false# ---------------------------- Elasticsearch Output ----------------------------output.elasticsearch: # Array of hosts to connect to. hosts: ["172.16.255.131:9200"] # 添加如下五行内容 # add index settings by wanghaihua at 2021.07.30 index: "nginx-%{[agent.version]}-%{+yyyy.MM}" # 限定日期形式{+yyyy.MM}采用这种配置可以自定义索引样式,并自定义Kibana中搜索的字段,删除冗余的解析字段 
04 使用 Filebeat 多节点采集 Nginx 日志数据
4.1 在其他节点上安装 Filebeat 和 Nginx从已经安装好的节点上将filebeat安装包拷贝到其他节点上 # 拷贝安装包scp filebeat-7.13.2-amd64.deb wang@172.16.255.132:/opt/es/scp filebeat-7.13.2-amd64.deb wang@172.16.255.139:/opt/es/# 在其他节点上安装filebeatcd /opt/es/sudo dpkg -i filebeat-7.13.2-amd64.deb # 安装deb包# 安装Nginxsudo apt-get install nginx -y
4.2 在其他节点上配置 Filebeat 和 Nginx从已经安装好的节点上将filebeat的配置文件拷贝到其他节点上 # 拷贝filebeat配置文件到一个暂存目录(直接拷贝到etc目录下可能存在权限问题)scp /etc/filebeat/filebeat.yml wang@172.16.255.132:/opt/es/scp /etc/filebeat/filebeat.yml wang@172.16.255.139:/opt/es/scp /etc/nginx/nginx.conf wang@172.16.255.132:/opt/es/scp /etc/nginx/nginx.conf wang@172.16.255.139:/opt/es/# 在对应节点上将配置文件移动到对应目录覆盖原始配置文件mv /opt/es/filebeat.yml /etc/filebeat/mv /opt/es/nginx.conf /etc/nginx/# 修改用户权限chown -R root:root /etc/nginx/nginx.confchown -R root:root /etc/filebeat/filebeat.yml
4.3 在其他节点上启动 Filebeat 和 Nginx启动Filebeat和Nginx并使用master节点的ab工具进行压测产生日志数据 # 启动Filebeat和Nginxsystemctl start nginxsystemctl start filebeat# 使用master节点的ab工具进行压测产生日志数据ab -n 100 -c 20 http://172.16.255.132/node1.htmlab -n 100 -c 20 http://172.16.255.139/node2.html# 查看产生的日志数据是否为Json格式tail -f /var/log/nginx/access.log Filebeat的配置文件将日志数据采集并存储在ES中,多个节点的日志数据被聚合在一个ES索引中保存。
05 收集 Nginx 错误日志收集错误日志的需求:要能够区分错误日志和正常日志,要能够是使用单独索引存储错误日志
5.1 配置 Filebeat 采集 Nginx 错误日志在filebeat配置文件etc/filebeat/filebeat.yml的inputs选项中添加如下内容 - type: log enabled: true paths: - /var/log/nginx/error.log tags: ["error"]
5.2 配置 Filebeat 采集日志时拆分错误日志和正常日志在filebeat配置文件etc/filebeat/filebeat.yml的输入中加入tags标识采集的不同类型日志数据,然后在索引设置中配置如下对日志进行拆分 # 在`output`中配置通过tags区分日志output.elasticsearch: hosts: ["172.16.255.131:9200"] indices: - index: "nginx-access-%{[agent.version]}-%{+yyyy.MM}" when.contains: tags: "access" - index: "nginx-error-%{[agent.version]}-%{+yyyy.MM}" when.contains: tags: "error"让其他节点上采集Nginx日志的Filebeat的配置文件于上述配置一致,直接将该filebeat的配置文件拷贝到其他节点上覆盖 # 拷贝filebeat配置文件到一个暂存目录(直接拷贝到etc目录下可能存在权限问题)scp /etc/filebeat/filebeat.yml wang@172.16.255.132:/opt/es/scp /etc/filebeat/filebeat.yml wang@172.16.255.139:/opt/es/# 在对应节点上将配置文件移动到对应目录覆盖原始配置文件mv /opt/es/filebeat.yml /etc/filebeat/# 修改用户权限chown -R root:root /etc/filebeat/filebeat.yml
06 Filebeat 采集 Nginx 日志的最终配置文件# ============================== Filebeat inputs ===============================filebeat.inputs:- type: log enabled: true paths: - /var/log/nginx/access.log json.keys_under_root: true json.overwrite_keys: true tags: ["access"]- type: log enabled: true paths: - /var/log/nginx/error.log tags: ["error"]# ======================= Elasticsearch template setting =======================setup.template.settings: index.number_of_shards: 1setup.template.name: "nginx"setup.template.pattern: "nginx-*"setup.template.enabled: falsesetup.template.overwrite: truesetup.ilm.enabled: false# ================================== Outputs ===========================# ---------------------------- Elasticsearch Output ----------------------------output.elasticsearch: hosts: ["172.16.255.131:9200"] indices: - index: "nginx-access-%{[agent.version]}-%{+yyyy.MM}" when.contains: tags: "access" - index: "nginx-error-%{[agent.version]}-%{+yyyy.MM}" when.contains: tags: "error"# ================================== Logging ===================================logging.level: infologging.to_files: truelogging.files: path: /var/log/filebeat name: filebeat keepfiles: 7 permissions: 0644
下载地址:
jenkins+docker+nginx+nodejs持续集成部署vue前端项目
SpringBoot项目整合FastDFS+Nginx实现图片上传功能 |


